


What we do » Research » Corruption Perceptions Index
1. What is the Corruption Perceptions Index (CPI)?
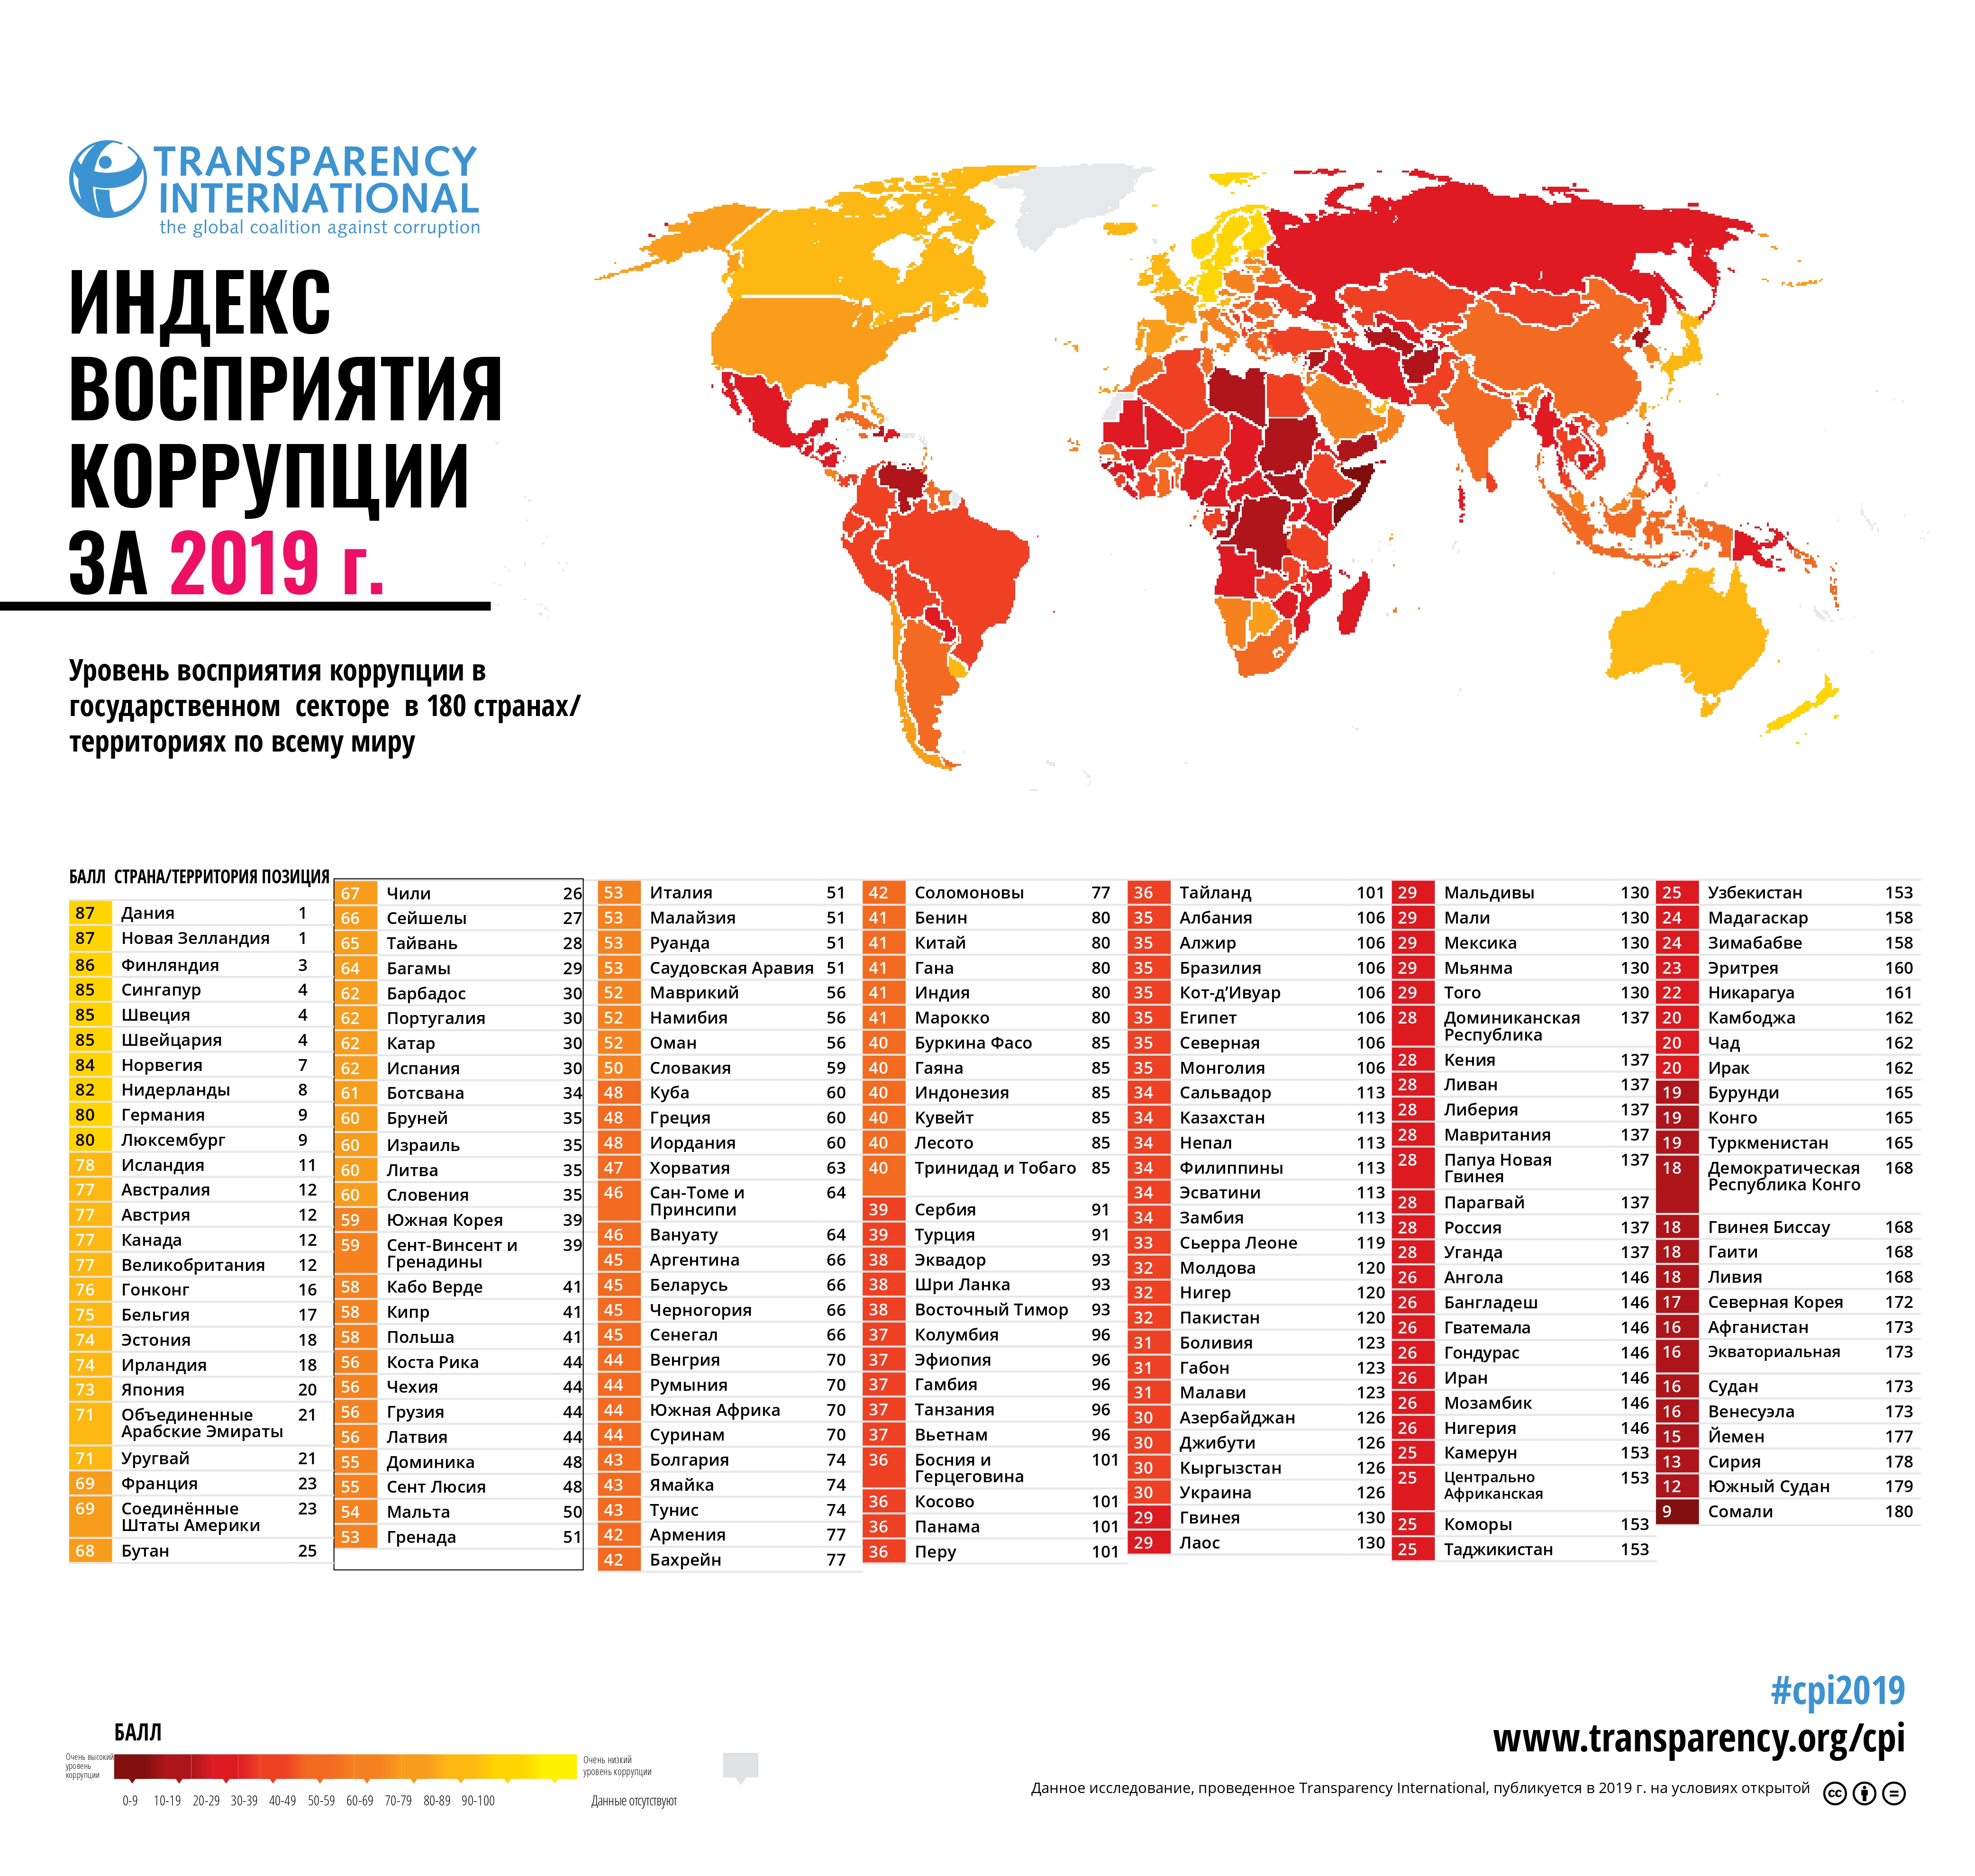
The CPI scores and ranks countries/territories based on how corrupt a country's public sector is perceive d to be. It is a composite index, a combination of surveys and assessments of corruption, collected by a variety of reputable institutions. The CPI is the most widely used indicator of corruption worldwide.
2. Why is the CPI based on perceptions?
Corruption generally comprises illegal activities, which are deliberately hidden and only come to light through scandals, investigations or prosecutions. There is no meaningful way to assess absolute levels of corruption in countries or territories on the basis of hard empirical data. Possible attempts to do so, such as by comparing bribes reported, the number of prosecutions brought or studying court cases directly linked to corruption, cannot be taken as definitive indicators of corruption levels. Instead, they show how effective prosecutors, the courts or the media are in investigating and exposing corruption. Capturing perceptions of corruption of those in a position to offer assessments of public sector corruption is the most reliable method of comparing relative corruption levels across countries.
3. Which countries/territories are included in the CPI 2013 and why?
For a country/territory to be included in the ranking, it must be included in a minimum of three of the CPI's data sources. If a country is not featured in the ranking, then this is solely because of insufficient survey information and not an indication that corruption does not exist in the country. This year 177 countries and territories are included in the index. In 2012, it was 176. The CPI 2013 now includes South Sudan.
4. What are the data sources for the CPI?
The 2013 CPI draws on data sources from independent institutions specialising in governance and business climate analysis. The sources of information used for the 2013 CPI are based on data gathered in the past 24 months. The CPI includes only sources that provide a score for a set of countries/territories and that measure perceptions of corruption in the public sector. Transparency International reviews the methodology of each data source in detail to ensure that the sources used meet Transparency International's quality standards.
5. What is the difference between a country/territory's rank and its score?
A country/territory's score indicates the perceived level of public sector corruption on a scale of 0-100, where 0 means that a country is perceived as highly corrupt and a 100 means that a country is perceived as very clean. A country's rank indicates its position relative to the other countries/territories included in the index. Ranks can change merely if the number of countries included in the index changes.
6. Is the country/territory with the lowest score the world's most corrupt nation?
No. The CPI is an indicator of perceptions of public sector corruption, i.e. administrative and political corruption. It is not a verdict on the levels of corruption of entire nations or societies, or of their policies, or the activities of their private sector. Citizens of those countries/territories that score at the lower end of the CPI often show the same concern about and condemnation of corruption as the public in countries that perform strongly.
Further, the country/territory with the lowest score is the one where public sector corruption is perceived to be greatest among those included in the list. The CPI provides no information about countries/territories that are not included in the index.
Press Release CPI- 2019: Global rus
Press Release CPI- 2019: Kyrgyz Republic
Press Release CPI- 2018: Global rus
Press Release CPI- 2018: Kyrgyz Republic
2018 CPI EasternEurope CentralAsia Map RU
Press Release CPI 2017 Kyrgyz Republic
Press Release CPI 2017 Global rus
Press Release CPI 2016 Kyrgyz RepublicPress Release CPI 2016 Global rus
CPI-2013 Infographics around the world